Mohammed Shajith Khan
Entry-level Data Analyst with hands-on experience in Python data analysis, Excel data cleaning and feature engineering, and Power BI dashboard development. Experienced in analyzing real-world datasets, building dashboards, and delivering clear, actionable business insights through data visualization and reporting.

Introduction
About
I'm an aspiring Data Analyst and Business Intelligence professional focused on transforming raw, unstructured data into clear and meaningful insights...
Tools & Technologies
Python | Power BI | SQL | Excel | Matplotlib | Pandas
6+
Months Experience
2
End-to-End Data Projects
4+
BI & Analytics Tools
100%
Hands-On Learning
Experience
Data Operations Intern
Omandurar Medical College | 6 Months
- Created operational reports and dashboards using Advanced Excel (Pivot Tables, charts, structured summaries).
- Cleaned, validated, and maintained hospital operational datasets, ensuring data accuracy and consistency.
- Prepared performance and summary reports to support management review and decision-making.
- Organized and standardized large datasets to improve reporting efficiency and readability.
- Assisted in tracking key operational metrics through regularly updated Excel reports.
- Worked with real-world healthcare data, following data confidentiality and documentation practices.
Technical Skills
Python
Advanced Excel
SQL
Power BI
Projects
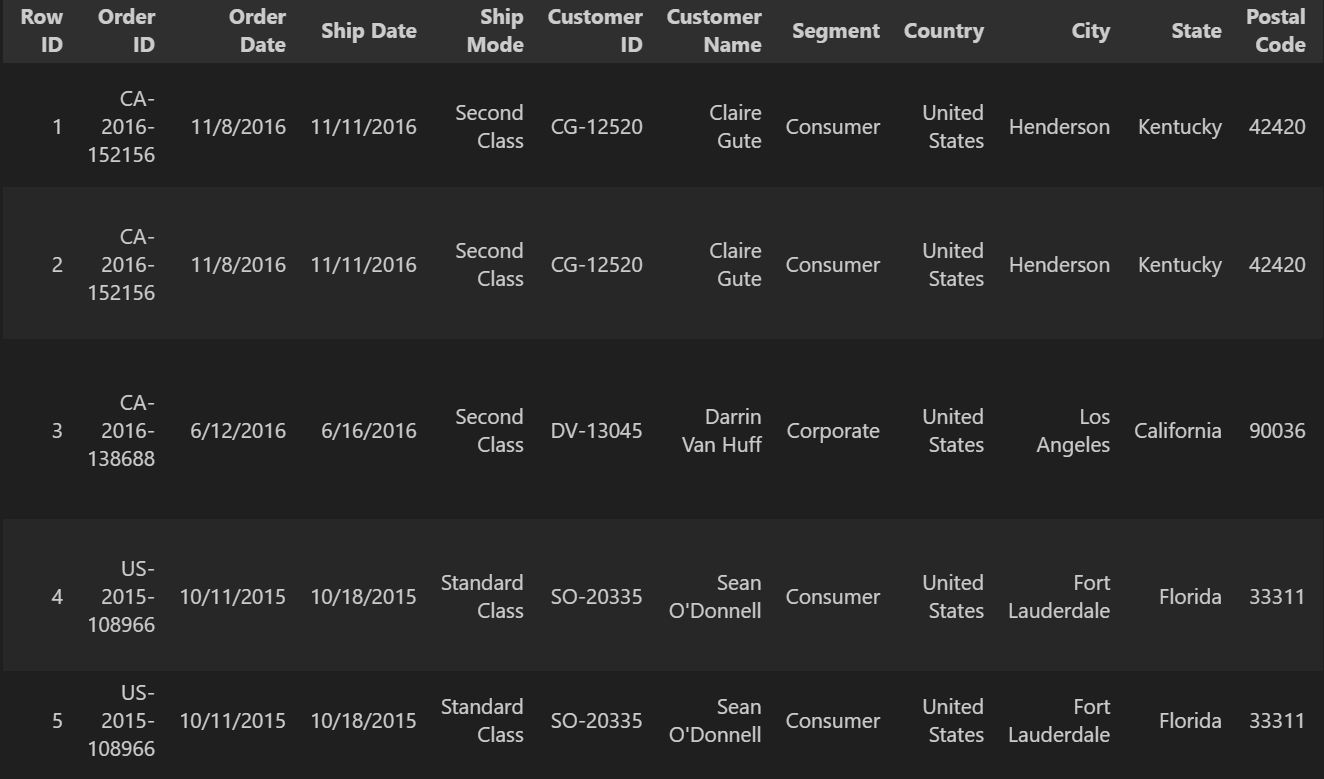
Sales & Retail Data Analysis
Analyzed a retail Superstore dataset containing over 6,000 records to uncover sales performance trends, profit drivers, and regional patterns.
- ✔ Cleaned and preprocessed retail sales data
- ✔ Explored trends in sales, profit, and discounts
- ✔ Evaluated regional and category performance
- ✔ Built business-focused visualizations
Key Insights
- Sales were concentrated in a few high-performing regions
- Heavy discounting reduced profit margins
- Some categories had high sales but weak profit
- Seasonal demand spikes were clearly visible
- Certain regions had steady sales but low profitability
Impact: Identified key loss-driving discount patterns and high-revenue low-profit categories, helping define data-backed pricing and sales strategies.
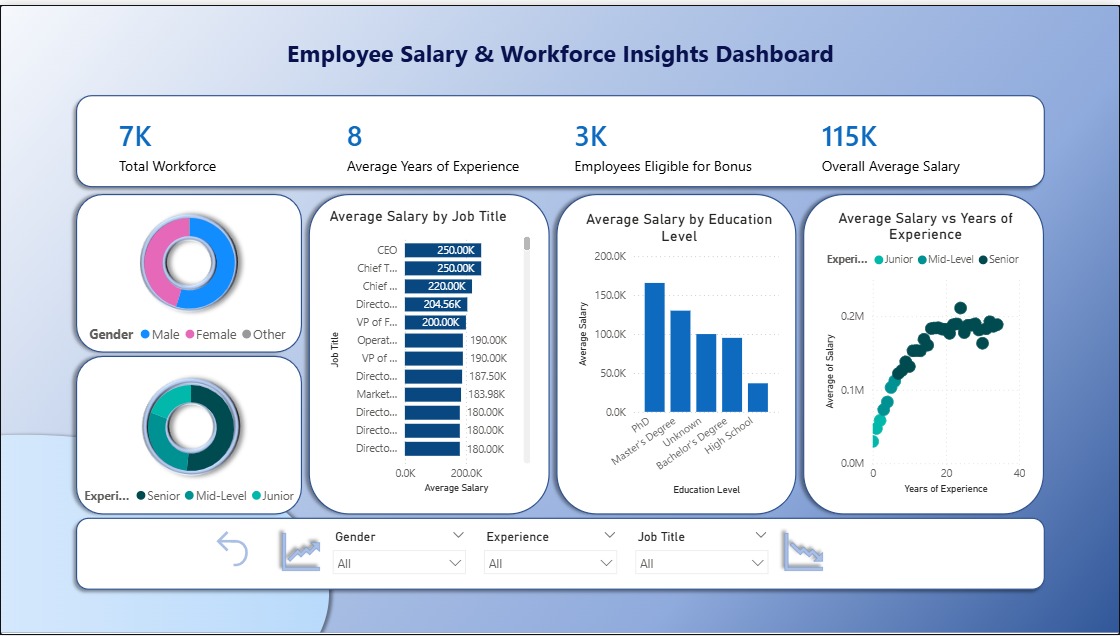
Employee Salary & Compensation Dashboard
Built an interactive dashboard analyzing employee salary distribution and compensation patterns.
- ✔ Cleaned and structured HR data in Excel
- ✔ Engineered salary and experience features
- ✔ Designed dashboard layout for storytelling
- ✔ Built Power BI visuals and DAX measures
Key Insights
- Salary growth plateaued after mid-level experience
- Wide salary variation existed across similar experience roles
- Salary per experience year declined at senior levels
- Specific roles dominated top salary bands
- Senior roles had higher pay dispersion than entry roles
Impact: Built a reusable HR dashboard for tracking compensation trends, pay gaps, and experience-based salary growth for better workforce planning.